Featured Activities and Deliverables:
Digital Merchandising Index Change Requests
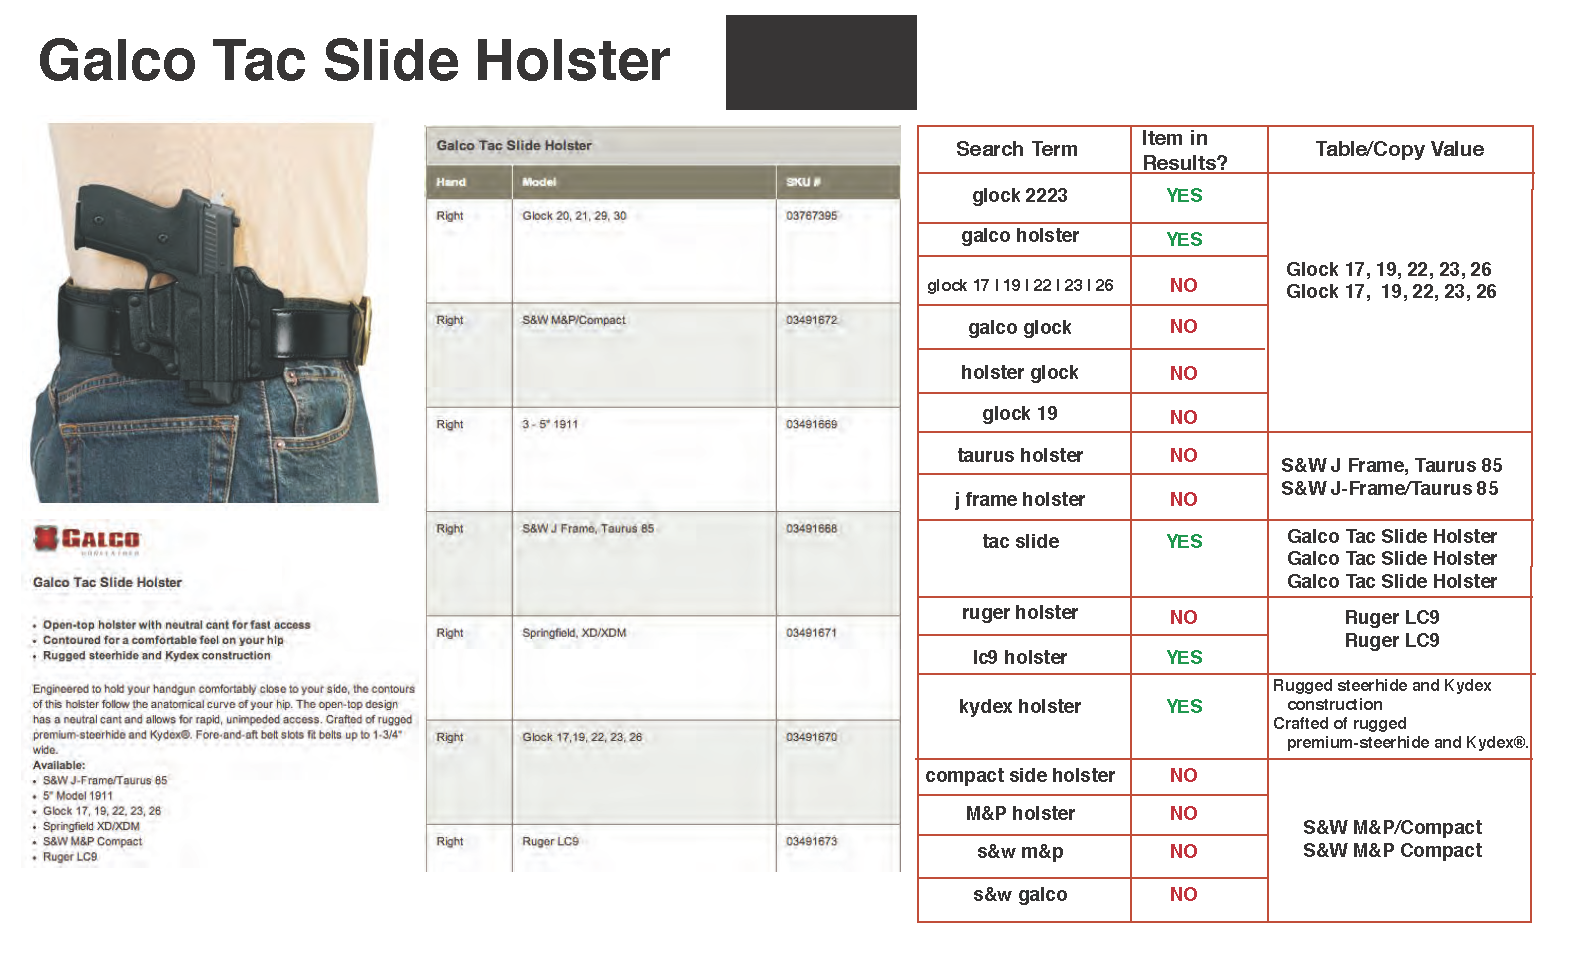
I inherited a structured digital merchandising change request process that involved evaluating submissions from Digital Merchandisers for proposed modifications of both product subcategory names and locations within the complex hierarchical structure of the client's eCommerce website.Each submission was evaluated by looking at information such as the products' performances in web analytics, the frequency of appearances of the product group name as a search term on both internal and external search engines, and identifying any potential conflicts with other departments' product mixes on the website.
Sample Index Change Request and Research
Back to Gallery
Reverse Card Sorting
To validate the taxonomy and product group location changes, I conducted remote Reverse Card Sorting studies. Using Treejack from Optimal Workshop, I input a partial listing of the current client site's hierarchical structure down to the subcategory level. Several products affected by recent taxonomy and/or site location changes were selected for the study. In the Reverse Card Sort, users were asked to click through digital "cards", starting at the highest department level on the website and continuing down the path that they thought would most likely lead them to the target product. The goal for our team was to see whether the changes we had implemented were in alignment with users' mental models.The users recruited were all customers who had purchased merchandise from the client's website at least once. Two rounds of testing were conducted during my time working with the client.
Recorded metrics included the frequency of correct responses, task completion time, and abandonment rate. An open comment field was displayed at the end of the studies to allow for the collection of any additional user feedback.
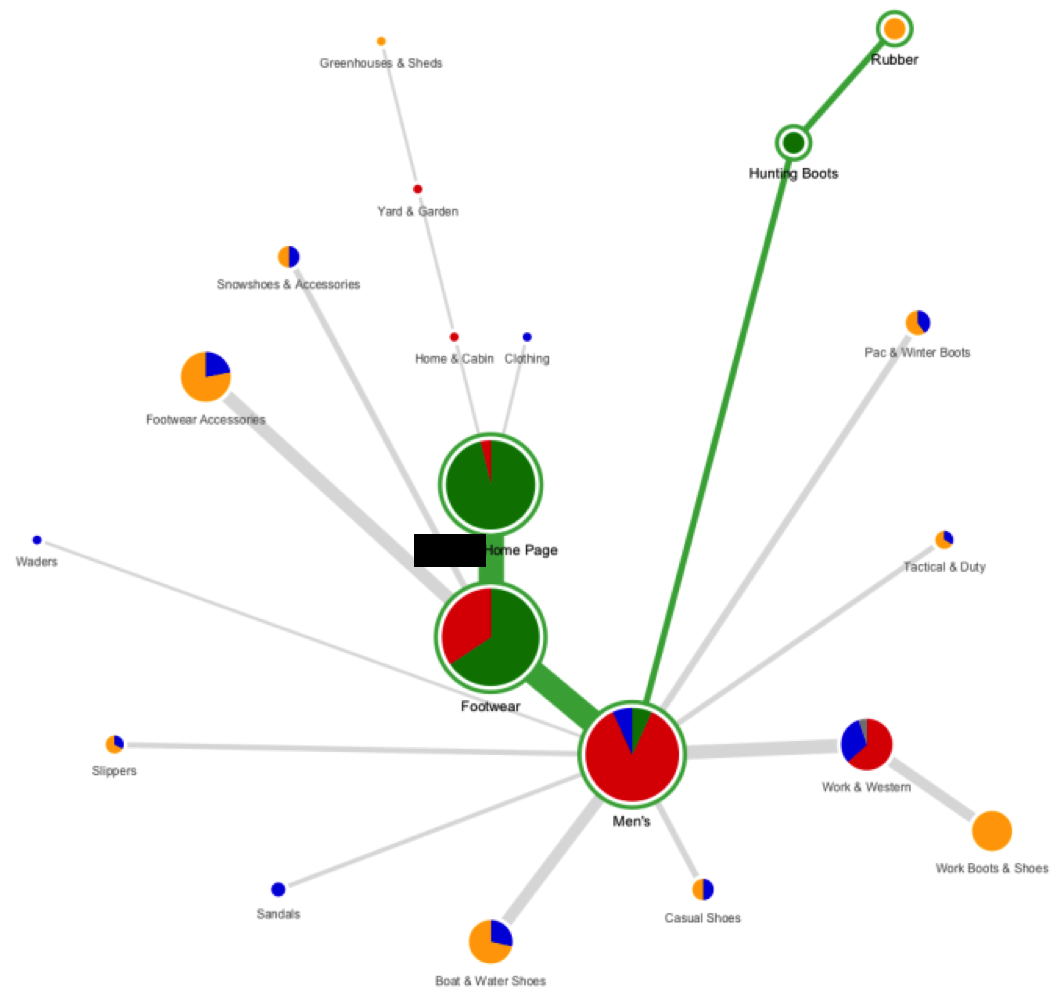
The results provided insight into which changes improved the customer shopping experience and which needed additional evaluation or needed to be reversed altogether. The data was presented in multiple formats, including a click-path visualization.
Sample Treejack Click-Path Visualization